Open Mapping Solutions
At HOT, we use a combination of open mapping tools developed by us and the open source community to create, access, manage, analyze, and share open map data that serves our partners and local communities.
Below you can explore some tools relevant to each part of the data workflows, enabling your mapping projects from start to finish. All tools below are either open source or relating to the promotion of open data. HOT’s tools, which fill a niche in end to end mapping workflows, are marked. For detailed explanation about HOT's tools, see Tech Product Suite pages.
Imagery & Earth Observation

Sensor data encompasses information obtainable through diverse platforms for capturing real-wold reference data.
- Satellite-borne data, primarily beneficial for large-scale solutions.
- Drone or aircraft data, presents promising opportunities for community-based initiatives through drone imagery.
- Ground-based data, sourced from phones, cars, etc., serves as input for mapping purposes, exemplified by datasets like Mapillary data and phone pictures.
Open Aerial Map (OAM)
The open collection of aerial imagery.
About
OpenAerialMap is an open service to provide access to a commons of openly licensed imagery and map layer services. Download or contribute imagery to the growing commons of openly licensed imagery.
OpenAerialMap creates a place for mappers to store and share their work with the rest of the community. Through this database, everyone has a go to point to start helping out, whether it’s drone pilots in areas of crisis, or mappers who want to trace from home.
Maxar Open Data Program
Satellite imagery for select sudden onset major crisis events.
About
The Open Data Program is our purpose in action. Maxar Intelligence supports the greater geospatial community by providing before and after satellite imagery in times of disaster. Organizations working on the front lines increase their impact and effectiveness by having access to this data.
When crises occur, Maxar is committed to supporting the humanitarian community by providing critical and actionable information to assist response efforts. Associated imagery is released into the public domain under a Creative Commons 4.0 license, allowing for rapid use and easy integration with existing humanitarian response technologies. (source: website)
Activation Criteria
- Sudden onset natural disaster.
- Categorized as a major event based on geographic scope, humanitarian impact and expectation of need.
- FirstLook event service has been activated.
Planet
Planet provides geospatial insights at the speed of change, equipping organizations with the data necessary to make informed, timely decisions. With best-in-class imagery, you can monitor areas of interest, validate information on the ground, and discover trends relevant to your organization.
About
In support of the International Disaster Charter, Planet make imagery of disaster areas around the globe available directly to the public, volunteers, humanitarian organizations, and other coordinating bodies. Disaster data is openly licensed under the Creative Commons: CC-BY-SA for commerical use, and CC-NC-BY for non-commerical use.
Disaster Data is available to anyone with a Planet API key: learn how to get your own API key here, or learn more about Planet Disaster Data. (source: website)
Features
- Python Library & CLI: The Python package planet is an Apache 2.0-licensed Python client library and command-line interface for working with Planet's public API.
- Jupyter Notebooks: The Developer Experience team at Planet has created a collection of Apache 2.0-licensed Jupyter Notebooks, along with a Docker image that makes it easy to run your own geospatially-enabled Jupyter instance.
- QGIS Plugin: Planet's Plugin for QGIS, which makes it easy for QGIS users to discover, stream and download Planet imagery, is also open source on Planet's Github.
Copernicus
Europe’s Eyes on Earth: Looking at our planet and its environment for the benefit of Europe’s citizens.
About
Copernicus Data Space Ecosystem, an open ecosystem that provides free instant access to a wide range of data and services from the Copernicus Sentinel missions and more on our planet’s land, oceans and atmosphere. (source: website)
Features
- Explore data: Access a wide range of Earth observation data from the Copernicus Sentinel missions and more. The Copernicus Data Space Ecosytem provides tools for easy discovery, visualization and download which will be continuously upgraded.
- Copernicus Browser: The service provides a powerful data analytics environment. Access a set of high-quality data processing tools to extract information valuable to conduct public, private or commercial activities. The Copernicus Data Space Ecosystem is set to be the next level of user data processing and distribution infrastructure.
- Data collections: The Copernicus Data Space Ecosystem is the next step in the evolution of Earth observation data. The Ecosystem aims to gather tools and resources to unlock the full potential of this data. This allows to build a thriving, open and expanding Ecosystem to increase the impact of Earth Observation data for a sustainable society.
NASA Earth Data
Your Gateway to NASA Earth Observation Data
About
The Earth Science Data Systems (ESDS) Program provides full and open access to NASA’s collection of Earth science data for understanding and protecting our home planet. Begin your Earthdata exploration by clicking on any of the discipline icons above. (source: website)
Features
- Get Started: NASA’s Earthdata website is your gateway to one of the planet’s largest repositories of Earth observation data. These data – along with the tools for analyzing and working with these data – are available to you fully, openly, and without restriction.
- Find Data: NASA acquires, archives, and distributes data from a variety of sources, including remote sensing instruments on satellite and airborne platforms, field campaigns, in situ measurements, and model outputs.
- Use Data: Earthdata provides a number of resources for accessing and using data, including tools for viewing imagery and creating visualizations of data.
Mapillary
Access street-level imagery and map data from all over the world. Fill in the gaps by capturing coverage yourself.
About
Mapillary brings together a global network of contributors who want to make the world accessible to everyone by visualizing the world and building better maps. Anyone can join and collect street-level images, using simple tools like smartphones or action cameras. With computer vision, we connect images across time and space to create immersive street-level views and extract map data. (source: website)
Features
- Any camera, anywhere: Capture imagery with any kind of camera to put places on the map through a collaborative street-level view of the world.
- Edit maps with a new point of view: Update maps with details that are not visible from aerial images, using street-level imagery from anywhere you need it.
- Let machines speed things up: Update maps faster and with less effort by using map features extracted with computer vision.
- Collaboration always wins: Open up data to help everyone make better decisions about cities and roads, mobility and navigation, and autonomous driving.
Data Collection: Remote

Remote mapping allows for data creation of an area of interest from anywhere in the world. Users use base imagery to identify features like buildings, roads, waterways, etc., and incorporate them into geospatial databases, like OpenStreetMap. Remote mapping can cover wide areas effectively and efficiently, and the information identified informs decision-making on the ground. Multiple tools connected to OpenStreetMap allow for organized collaboration and crowdsourcing of massive data collection and creation, as well as data improvement efforts.
Tasking Manager
Join a global community that is mapping the places most vulnerable to disaster and poverty in order to support humanitarian aid and sustainable development across the world.
About
Each year, disasters around the world kill nearly 100,000 and affect or displace 200 million people. Mapping can help change this. Organizations use Tasking Manager to create mapping projects for areas around the world where data is needed to help save or improve lives.
Features
- Mapping: Volunteers use satellite imagery from OpenStreetMap to trace buildings, roadways, and other features.
- Validation: Experienced volunteers check the map data to ensure it is high quality.
- Using the data: Humanitarian organizations use the map data to plan for disaster response and other life saving activities.
fAIr: AI Assisted Mapping
- f: for freedom and free and open-source software
- AI: for Artificial Intelligence
- r: for resilience and our responsibility for our communities and the role we play within humanitarian mapping
About
fAIr is an open AI-assisted mapping service developed by the Humanitarian OpenStreetMap Team (HOT) that aims to improve the efficiency and accuracy of mapping efforts for humanitarian purposes. The service uses AI models, specifically computer vision techniques, to detect objects such as buildings, roads, waterways, and trees from satellite and UAV imagery. (source: website)
Features
- Goal is to provide AI-assisted mapping across mobile and in-browser editors using community-created models, enhancing relevance to improve living conditions.
- Utilizes open-source AI models trained by local communities.
- Uses open-source satellite and UAV imagery from HOT's OpenAerialMap (OAM) for feature detection and suggestions to OpenStreetMap (OSM).
- Offers free and open-source service, allowing OSM community members to create and train their own AI models for mapping.
- Receives constant feedback from local communities to progressively refine models, suggesting detected features for addition to OSM while avoiding mass imports. Corrections made by OSM mappers further enhance model accuracy.
Rapid
Rapid is a web-based modern editor for OpenStreetMap. Rapid integrates advanced mapping tools, authoritative geospatial open data, and cutting-edge technology to empower mappers at all levels to get started quickly, making accurate and fresh edits to maps.
About
Rapid is enhanced with authoritative open data sources and AI-generated roads from the Facebook Map With AI service and buildings from Microsoft open buildings dataset to make adding and editing roads, buildings, and more quick and simple.
Rapid also includes data integrity checks to ensure that new map edits are consistent and accurate.
Features
- Map Faster: The new Rapid editor saves you the effort of manually drawing map geometry by tapping into open data or predicted features identified by artificial intelligence.
- Map Better: AI-analyzed satellite imagery gives you a high-level overview of unmapped and missing data around the globe.
- Machine Learning: Rapid displays open map data and machine learning detections.
MapRoulette
Thousands of people just like you edit OpenStreetMap every day
About
MapRoulette has dozens of mapping challenges that are created by experienced mappers. Each challenge is about improving OSM in one very specific way. Do you want to add pedestrian crossings? Fix bridges? Add opening times for shops? There’s a challenge for it. Each challenge has many tasks, perhaps even thousands.
Do as few or as many as you want. If a challenge is too easy or too hard for you, just jump into something else, knowing that every time you click ‘I fixed it!’, you have made a meaningful contribution to the world’s maps. (source: website)
Features
- Work at your own level, from novice to expert.
- Find mapping tasks that are important to you.
- Create tasks for others to improve OSM together.
MapSwipe
Volunteer from your phone. Make a difference worldwide.
About
MapSwipe harnesses the collective strength of volunteers to actively contribute to geospatial data projects. From identifying infrastructure to tracking environmental changes and validating map data, MapSwipers help improve map data across the world.
As a result, our MapSwipe partners are better equipped and informed to engage and support communities globally. (source: website)
Features
- Find: Swipe through satellite images to identify & select those that contain the requested features such as buildings, roadways, waterways and more.
- Compare: Review before and after satellite images to detect changes in the environment that help inform damage assessment, climate change, or inaccurate data.
- Validate: Assess building footprints for accuracy where buildings have been previously traced by remote mappers or through AI to identify where remapping is needed.
Data Collection: Field

Add depth to extracted data by incorporating critical local knowledge, which is often absent in sensor data and requires human input for accuracy. For instance, details like doctor availability in hospitals or vulnerability to disasters are best verified locally. Local field mapping plays a pivotal role in prioritizing community involvement.
Field-TM
Coordinated field data collection: Similar to HOT’s remote Tasking Manager, Field-TM reduces duplication of missing areas. Field-TM facilitates collaborative mapping by supporting and extending existing ODK based mature tools.
About
Feature locations in OpenStreetMap and other open spatial datasets are nearing global coverage, but detailed information on mapped features is still lacking. Information such as feature names, materials, or condition are best mapped on the ground by local community members and requires coordination at scale. (source: website)
Features
- Project coordination: Field-TM applications improve the mapping productivity (mapped features/person-day) by reducing the duplication of efforts and avoiding missed areas by allocating task areas to mappers.
- Field data collection: Unlike other ODK based platforms, Field-TM is intended for adding attributes to existing geographical features such as buildings or Points of Interest (POIs).
- Data upload and validation: Field-TM improves data quality by including a validation mechanism, that ensures data completeness and interoperability.
Mapillary
Access street-level imagery and map data from all over the world. Fill in the gaps by capturing coverage yourself.
About
Mapillary brings together a global network of contributors who want to make the world accessible to everyone by visualizing the world and building better maps. Anyone can join and collect street-level images, using simple tools like smartphones or action cameras. With computer vision, we connect images across time and space to create immersive street-level views and extract map data. (source: website)
Features
- Any camera, anywhere: Capture imagery with any kind of camera to put places on the map through a collaborative street-level view of the world.
- Edit maps with a new point of view: Update maps with details that are not visible from aerial images, using street-level imagery from anywhere you need it.
- Let machines speed things up: Update maps faster and with less effort by using map features extracted with computer vision.
- Collaboration always wins: Open up data to help everyone make better decisions about cities and roads, mobility and navigation, and autonomous driving.
Open Data Kit (ODK) Collect
ODK lets you build powerful forms to collect the data you need wherever it is.
About
ODK Collect is an Android app for filling out forms. It is designed to be used in resource-constrained environments with challenges such as unreliable connectivity or power infrastructure. ODK Collect is part the ODK project, a free and open-source set of tools which help organizations author, field, and manage mobile data collection solutions. (source: website)
Features
- Build powerful forms: Include photos, GPS locations, skip logic, calculations, external datasets, multiple languages, and more.
- Works online and offline: Use either the mobile app or the web app. Your data is automatically synced when an Internet connection is found.
- Analyze with ease: Download your data or connect apps like Excel, Power BI, Python, or R to create real-time dashboards.
- Open-source software: ODK puts you in complete control of your data collection. Use as is or customize as you see fit.
Organic Maps
About
Organic Maps is a community-developed, privacy-focused and offline navigation app [that lets you add data to OpenStreetMap].
This app has the main features of no location tracking and no data collection. The map data is downloaded to the phone so search, routing, and navigation can operate without a cell phone signal, ideal for travel to locations with poor connections. Organic Maps uses the crowdsourced map data from OpenStreetMap. (source: website)
Features
- Detailed offline maps with places that don't exist on other maps, thanks to OpenStreetMap.
- Lets you add data to OpenStreetMap.
- Contour lines, elevation profiles, peaks, and slope.
- Export/import bookmarks in KML/KMZ, import GPX.
- Free and open-source.
OsmAnd
About
OsmAnd is a map and navigation app for Android and iOS. It uses the OpenStreetMap map database for its primary displays, but is an independent app not endorsed by the OpenStreetMap Foundation. It is available in both free and paid versions; the latter unlocks the download limit for offline maps and provides access to Wikipedia points of interest and their descriptions from within the app. (source: website)
Features
- Map: Carry highly detailed, fully offline maps of any region world wide on your device.
- Navigation: Works totally offline.
- Open Source: Compact offline vector maps.
- Open-source software: ODK puts you in complete control of your data collection. Use as is or customize as you see fit.
QField
About
QField is an open-source application that allows painless fieldwork and synchronisation with your local QGIS projects. You can both use it in online and offline settings, link to external databases or work with simple geospatial formats. Once your QGIS project is ready for fieldwork it needs to be "packaged" with the QFieldSync Plugin, then synced and loaded into QField for mapping.
StreetComplete
About
This app finds missing map data in your vicinity and displays it on a map as quests. Solve each quest by visiting the location on-site and answering a simple question to update the map.
The app is made specifically for casual contributors and beginners as no prior knowledge about OpenStreetMap (such as tagging schemes) is required to contribute with this app. Furthermore, there is a bit of gamification and statistics that aim to introduce and try to inspire users to venture deeper into the world of OpenStreetMap. (source: website)
Ushahidi
About
Ushahidi is an open source software application which utilises user-generated reports to collate and map data. It uses the concept of crowdsourcing serving as an initial model for what has been coined as “activist mapping” – the combination of social activism, citizen journalism and geographic information.
Ushahidi allows local observers to submit reports using their mobile phones or the Internet, creating an archive of events with geographic and time-date information.
(source: website)
Features
- Holistic data gathering platform & integrated tools: The Ushahidi Platform brings together multiple data-gathering tools and services to save time and simplify processes, allowing users to focus on their goals and objectives rather than the tools that help achieve them.
- Accessible, easy-to-use and open-source: Our Platform is intended to be used by anyone, anywhere, and is flexibly built using a mobile-first approach to ensure device and network compatibility around the world. We also make our tools open-source in the spirit of improving technology accessibility and affordability to all.
- Available globally in dozens of languages: With deployments in more than 160 countries and over 40 languages, the Ushahidi Platform provides value and helps communities achieve solutions around the world.
Data Analysis and Open Data Insights
Connecting data to real-world decisions comes through data manipulation and exploration. The tools below allow users to examine the content and availability of OpenStreetMap data, and to analyze it to solve current local challenges.
QGIS
A free and open source geographic information system.
About
QGIS, or Quantum GIS, is an open-source geographic information system (GIS) software that allows users to create, edit, visualize, analyze, and publish geospatial information. It provides a wide range of tools for working with geographic data, including mapping, spatial analysis, and data visualization. QGIS supports various data formats and projections, making it suitable for a diverse range of applications, from environmental management and urban planning to agriculture and disaster response. It is widely used by individuals, organizations, and governments for its flexibility, ease of use, and extensive community support. (source: website)
Features
- Data visualization and mapping: QGIS facilitates creation of customizable, visually appealing maps with diverse data layers.
- Spatial analysis tools: Offers a suite of tools for comprehensive spatial analysis, supporting tasks like proximity and overlay analysis.
- Plugin architecture: Its plugin architecture enables users to enhance functionality with a wide range of community-developed plugins, tailored to specific tasks and workflows.
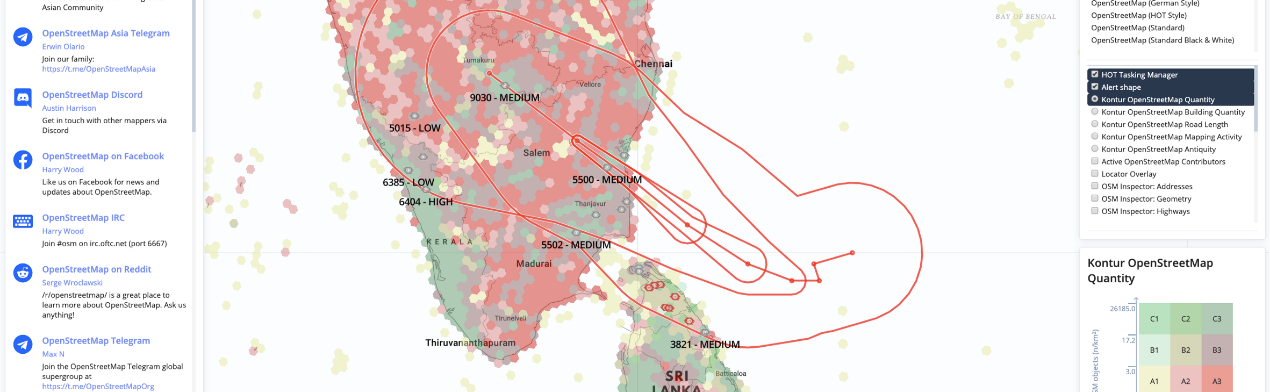
Disaster Ninja
A mapping tool for rapid geospatial decision making.
About
Disaster Ninja is a critical event management solution that provides information about recent natural disasters, visualizes mapping gaps, and helps you connect with locals for ground truth verification.
While you cannot map new objects in Disaster Ninja directly, the tool enables humanitarian organizations to prepare and prioritize new tasks for subsequent mapping rapidly. Swift and reliable decisions about when and where to start mapping can save precious time for disaster response during a crisis. (source: website)
Kepler
Make an impact with your location data. Kepler.gl is a powerful open source geospatial analysis tool for large-scale data sets.
About
Kepler.gl is a data-agnostic, high-performance web-based application for visual exploration of large-scale geolocation data sets. Built on top of MapLibre GL and deck.gl, kepler.gl can render millions of points representing thousands of trips and perform spatial aggregations on the fly.
Kepler.gl is also a React component that uses Redux to manage its state and data flow. It can be embedded into other React-Redux applications and is highly customizable. For information on how to embed kepler.gl in your app take a look at this step-by-step tutorial on vis.academy. (source: website)
Observable Framework
Observable Framework — or “Framework” for short — is an open-source static-site generator for data apps. By data app we mean an application that is primarily a display of data. Data apps help you derive insights (to understand) and evaluate potential decisions (to take action).
About
Good data apps are highly customized — they present an opinionated perspective and reflect your brand. Point-and-click tools may be easy to use but suffer from limited expressivity and power. With code, there’s no limit to what you can create. (See our D3 and Plot galleries for inspiration)
Modern development is a marvel. Framework is free and open-source, and projects are just local files, making it easy to incorporate into your existing workflow. Use your preferred editor, source control, and code review system. Write unit tests. Run linters. Automate builds with continuous integration or deployment. Work offline. Self-host. Generate or revise content programmatically with AI. You can do it all. (source: website)
Data Visualization

All data tells a story, and through visualization, that story turns into a message. Data visualization communicates complex spatial dynamics to inform real world decisions. The cartographic and other visualization tools featured here allow data to be more clearly communicated to key decision makers.
D3
The JavaScript library for bespoke data visualization. Create custom dynamic visualizations with unparalleled flexibility.
About
D3 (or D3.js) is a free, open-source JavaScript library for visualizing data. Its low-level approach built on web standards offers unparalleled flexibility in authoring dynamic, data-driven graphics. For more than a decade D3 has powered groundbreaking and award-winning visualizations, become a foundational building block of higher-level chart libraries, and fostered a vibrant community of data practitioners around the world. (source: website)
Healthsites
About
When a natural disaster or disease outbreak occurs there is a rush to establish accurate health care location data that can be used to support people on the ground.
This has been demonstrated by events such as the Haiti earthquake and the Ebola epidemic in West Africa. As a result valuable time is wasted establishing accurate and accessible baseline data. Healthsites.io establishes this data and the tools necessary to upload, manage and make the data easily accessible. (source: website)
Features
- Data model: Each healthsite is stored as a geometry object in the database.
- Share healthsite data: Please contact us should you wish to share data and we will assist you.
MapLibre
About
MapLibre are a set of open-source SDKs for developing web and mobile applications developed by a community of companies and freelance developers. (source: website)
Features
- MapLibre GL JS: Open-source TypeScript library for publishing maps on your website. Great performance due to GPU-accelerated vector tile rendering.
- MapLibre Native: Open-souce C++ library for displaying maps inside of your mobile applications, desktop application, or embedded devices. GPU-acceleration through OpenGL and Metal.
- MapLibre RS: Experimental portable and performant vector maps renderer based on WebGPU and Rust, with web support though WebAssembly.
uMap
About
uMap lets you create maps with OpenStreetMap layers in a minute and embed them in your site. (source: website)
Features
- Choose the layers of your map.
- Add POIs: markers, lines, polygons.
- Manage POIs colours and icons.
- Manage map options: display a minimap, locate user on load.
- Batch import geostructured data (geojson, gpx, kml, osm...).
- Choose the license for your data.
- Embed and share your map.
Open Data Access & Sharing

Accessing and using pre-existing geospatial datasets can be challenging due to the different sources and use licenses associated with them. Projects like OpenStreetMap (OSM), a global, open, and crowdsourced dataset, allow users to access their data and utilize it for a variety of purposes. Accessing OSM data in an easy to use format is accessible through the following tools.
Export Tool
Download OpenStreetMap data.
About
The Export Tool is an open service that creates customized extracts of up-to-date OSM data in various file formats. Download and use the data simply by crediting the OpenStreetMap contributors.
Features
- Customized data exports: Generate customized exports of OpenStreetMap data tailored to specific geographic regions and thematic needs, supporting humanitarian and disaster response efforts.
- Flexible output formats: Flexibility in output formats, enabling users to export data in various formats such as shapefiles, GeoJSON, and OSM XML, facilitating compatibility with different GIS software and analysis tools.
- Live database: Access to up-to-date OpenStreetMap data, allowing users to access the latest information for their mapping and analysis tasks in humanitarian contexts, ensuring relevance and accuracy in decision-making processes.
Raw Data API
About
Raw Data API is a set of high-performant APIs for transforming and exporting OpenStreetMap (OSM) data in different GIS file formats. (source: website)
Features
- Built on top of FastAPI.
- OAUTH 2.0 Authentication with OpenStreetMap(OSM).
- Multiple GIS formats support via GDAL's ogr2ogr - (supported formats: Esri Shapefile, KML, Mbtiles, FlatGeoBuf, CSV, GeoPackage, PGDUMP, GeoJSON, Pmtiles, MVT, MBTiles). Out of which, GeoJSON Follows Own Raw Data API conversion script.
Humanitarian Data Exchange (HDX)
About
The Humanitarian Data Exchange (HDX) is an open platform for sharing data across crises and organisations. Launched in July 2014, the goal of HDX is to make humanitarian data easy to find and use for analysis. Our growing collection of datasets has been accessed by users in over 250 countries and territories.
HDX is managed by OCHA's Centre for Humanitarian Data, which is located in The Hague, the Netherlands. OCHA is part of the United Nations Secretariat and is responsible for bringing together humanitarian actors to ensure a coherent response to emergencies. The HDX team includes OCHA staff and a number of consultants, based in North America, Europe, Africa, the Middle East and Asia. (source: website)
Overpass Turbo
Overpass turbo (overpass-turbo.eu) is a web based data mining tool for OpenStreetMap.
About
It runs any kind of Overpass API query and shows the results on an interactive map. Using it can get technical quite quickly: beginners may find the "wizard" a good place to start.
This project is maintained by Martin Raifer. The source code is found on GitHub. A huge thanks goes to Roland who created the Overpass API, without which this tool wouldn't exist. (source: OSM Wiki)
